Stochastic Models Project
Metro Bogotá
A Shiny dashboard that models station occupancy, train lifecycle states, and wagon-dispatch decisions using Markov chains and stochastic dynamic programming.
What it does
- Fase 1: Continuous-time Markov chain occupancy analysis for three stations.
- Fase 2: Discrete-time Markov chain lifecycle/cost analysis from uploaded
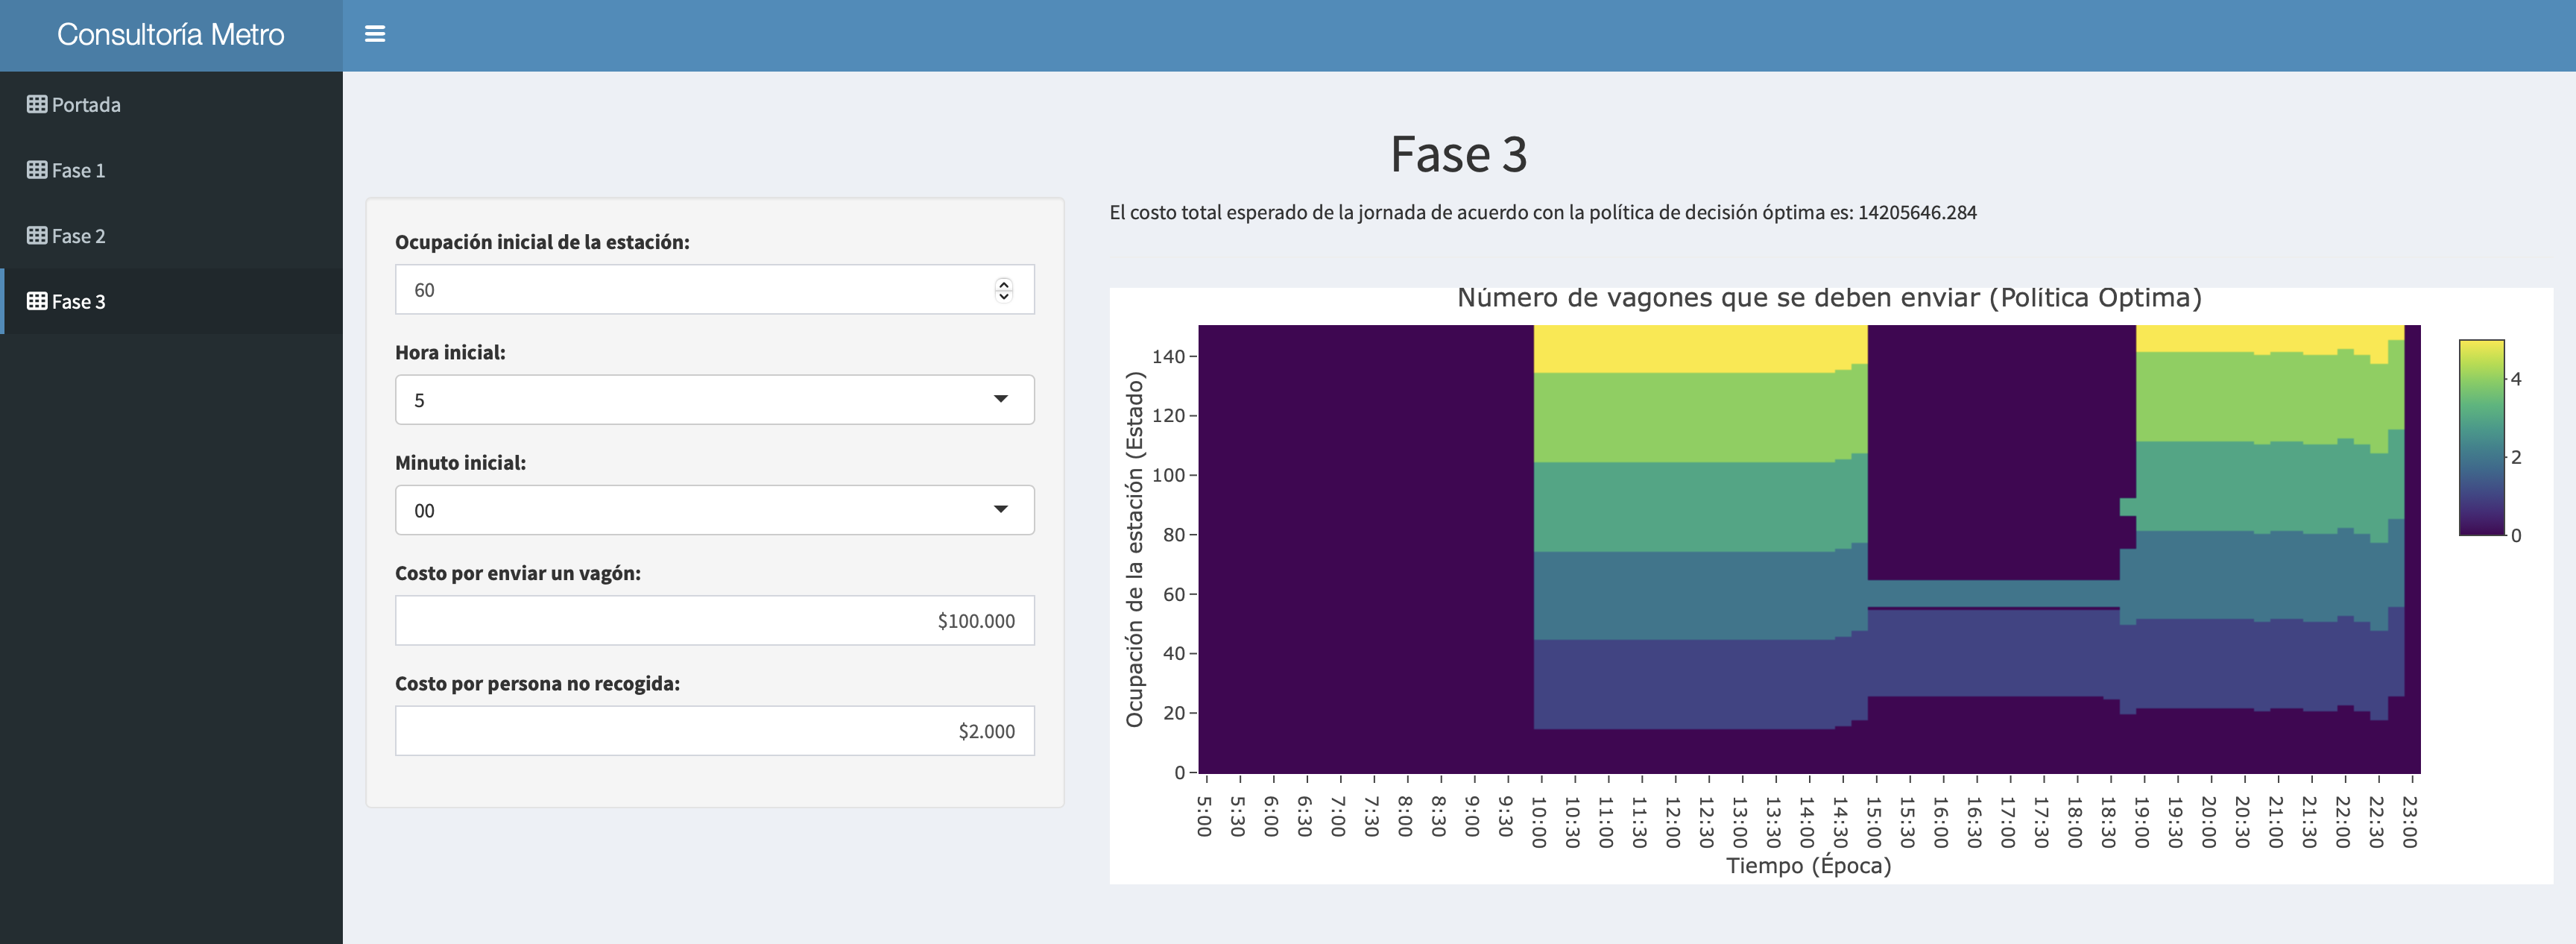
.xlsxdata. - Fase 3: Stochastic dynamic programming policy for wagon dispatch with cost minimization.
Main dashboard view
Detailed phase analysis
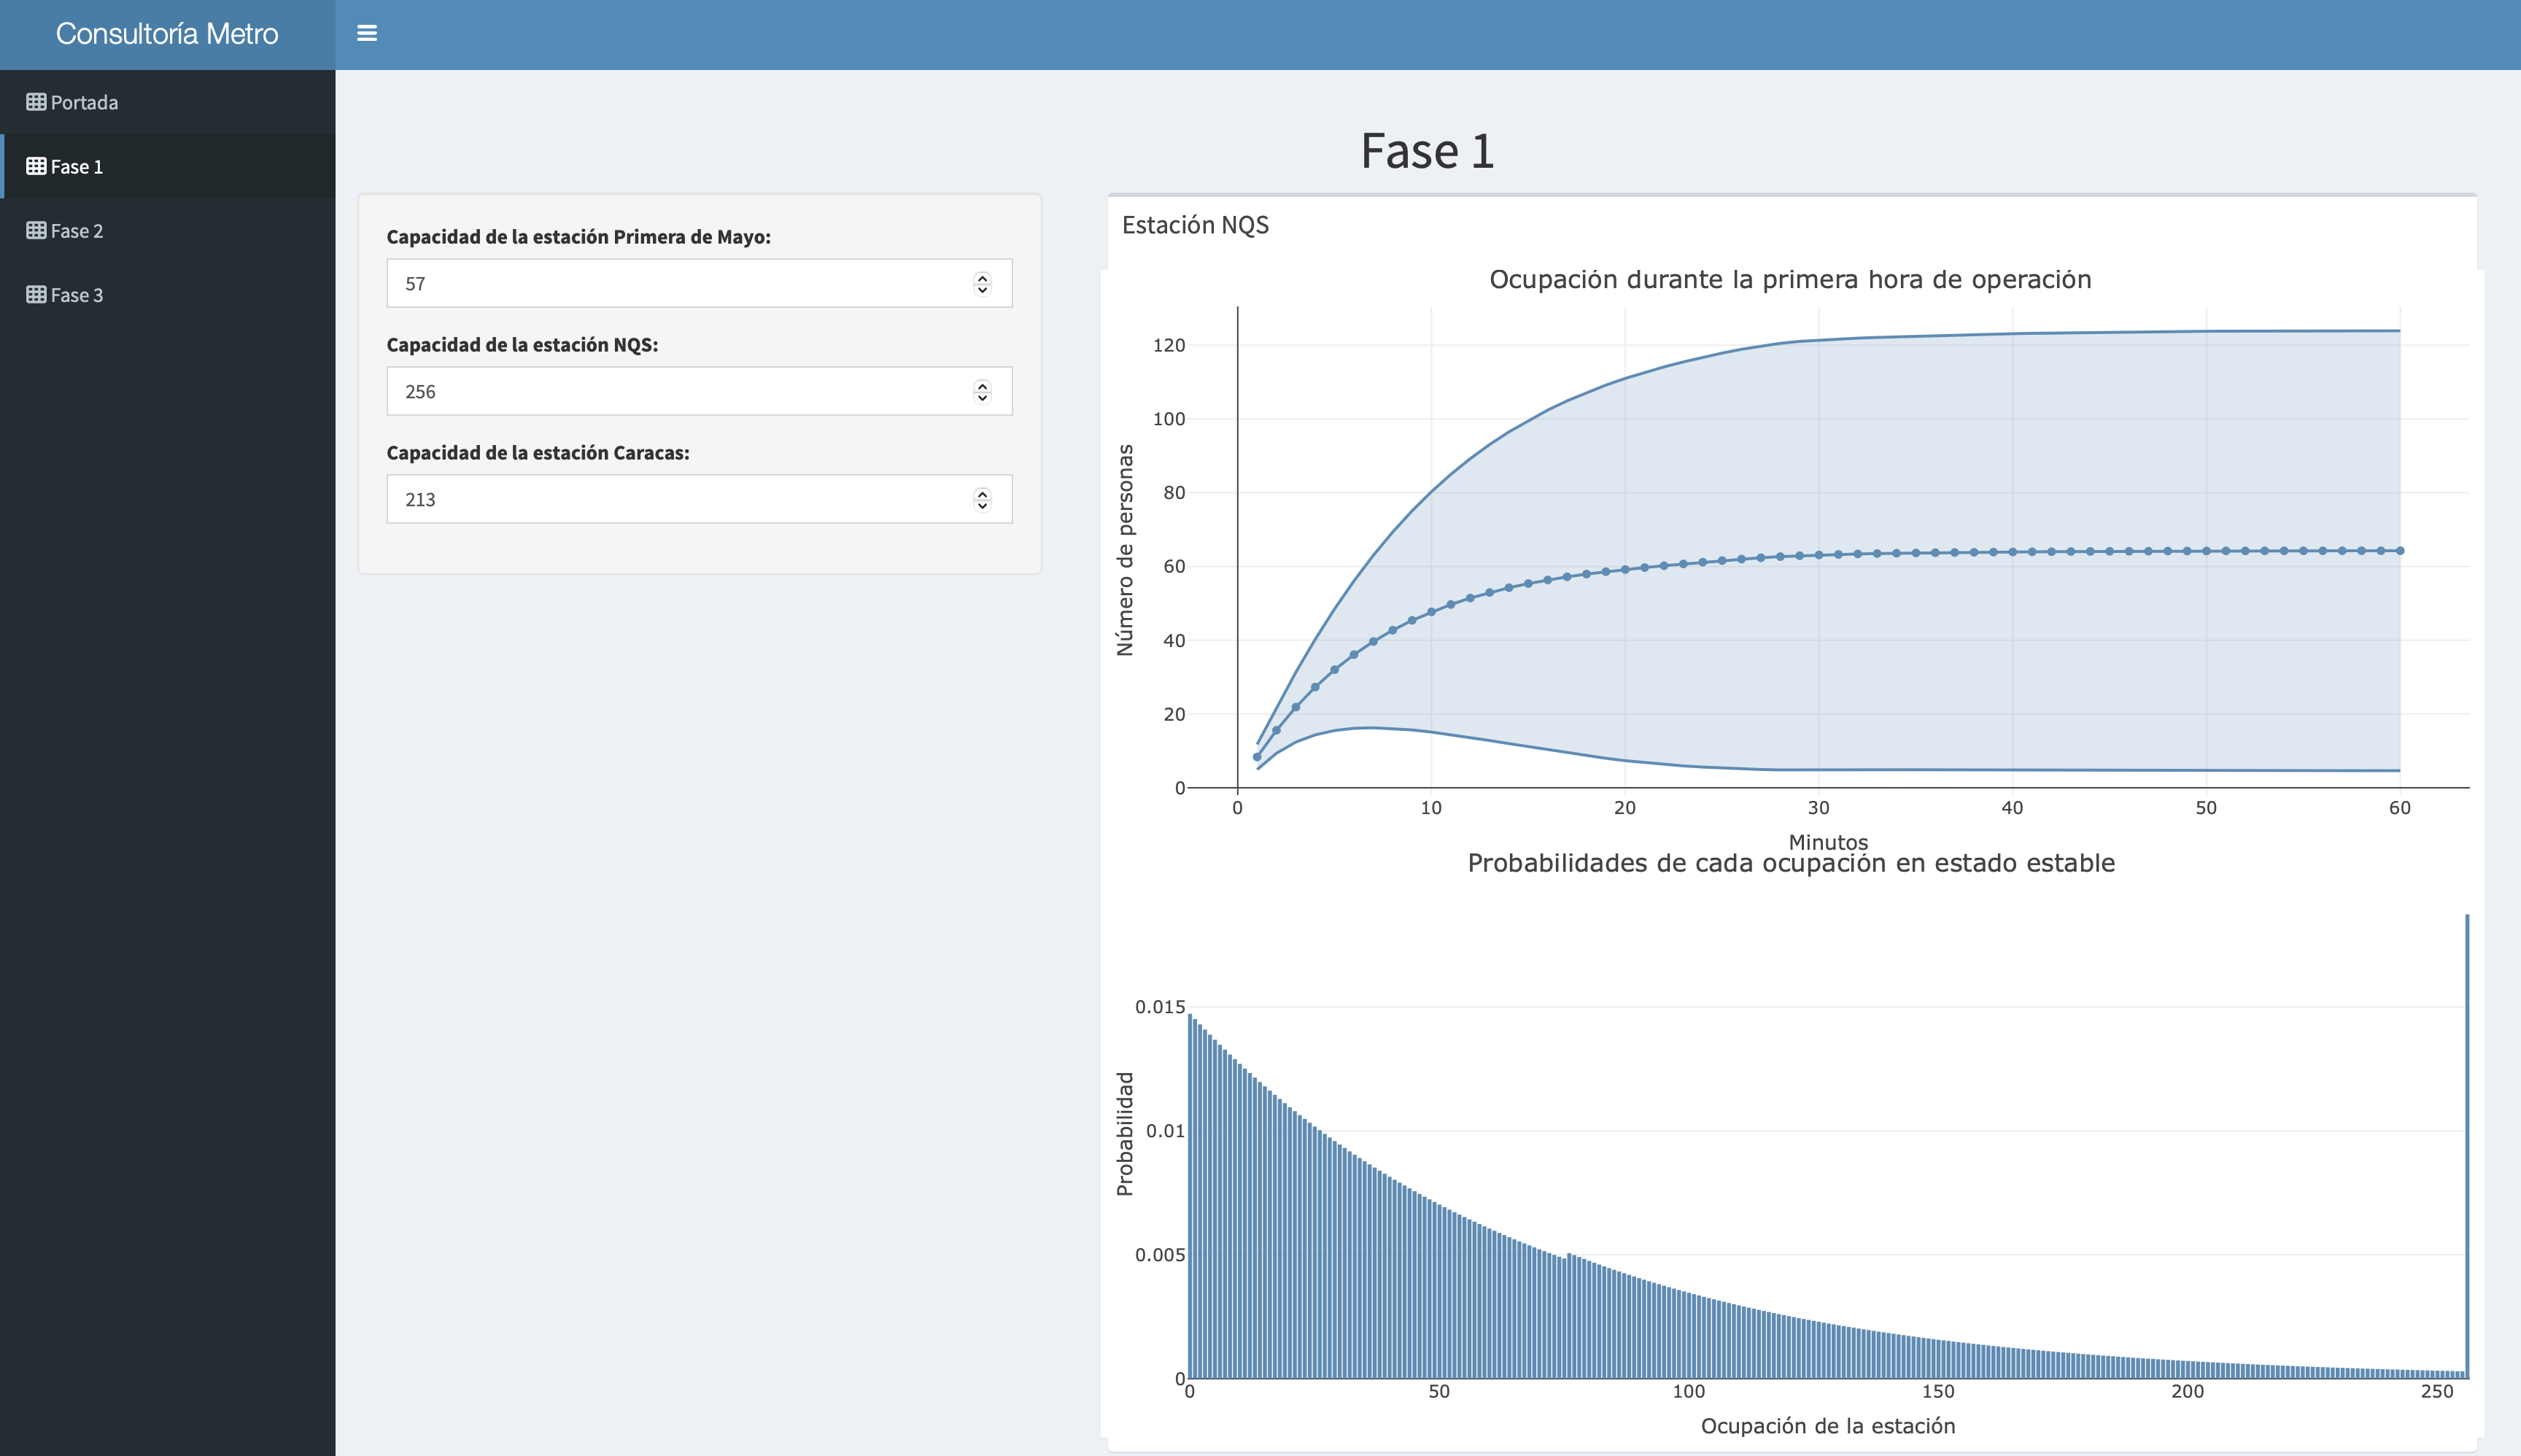
Interactive visualizations
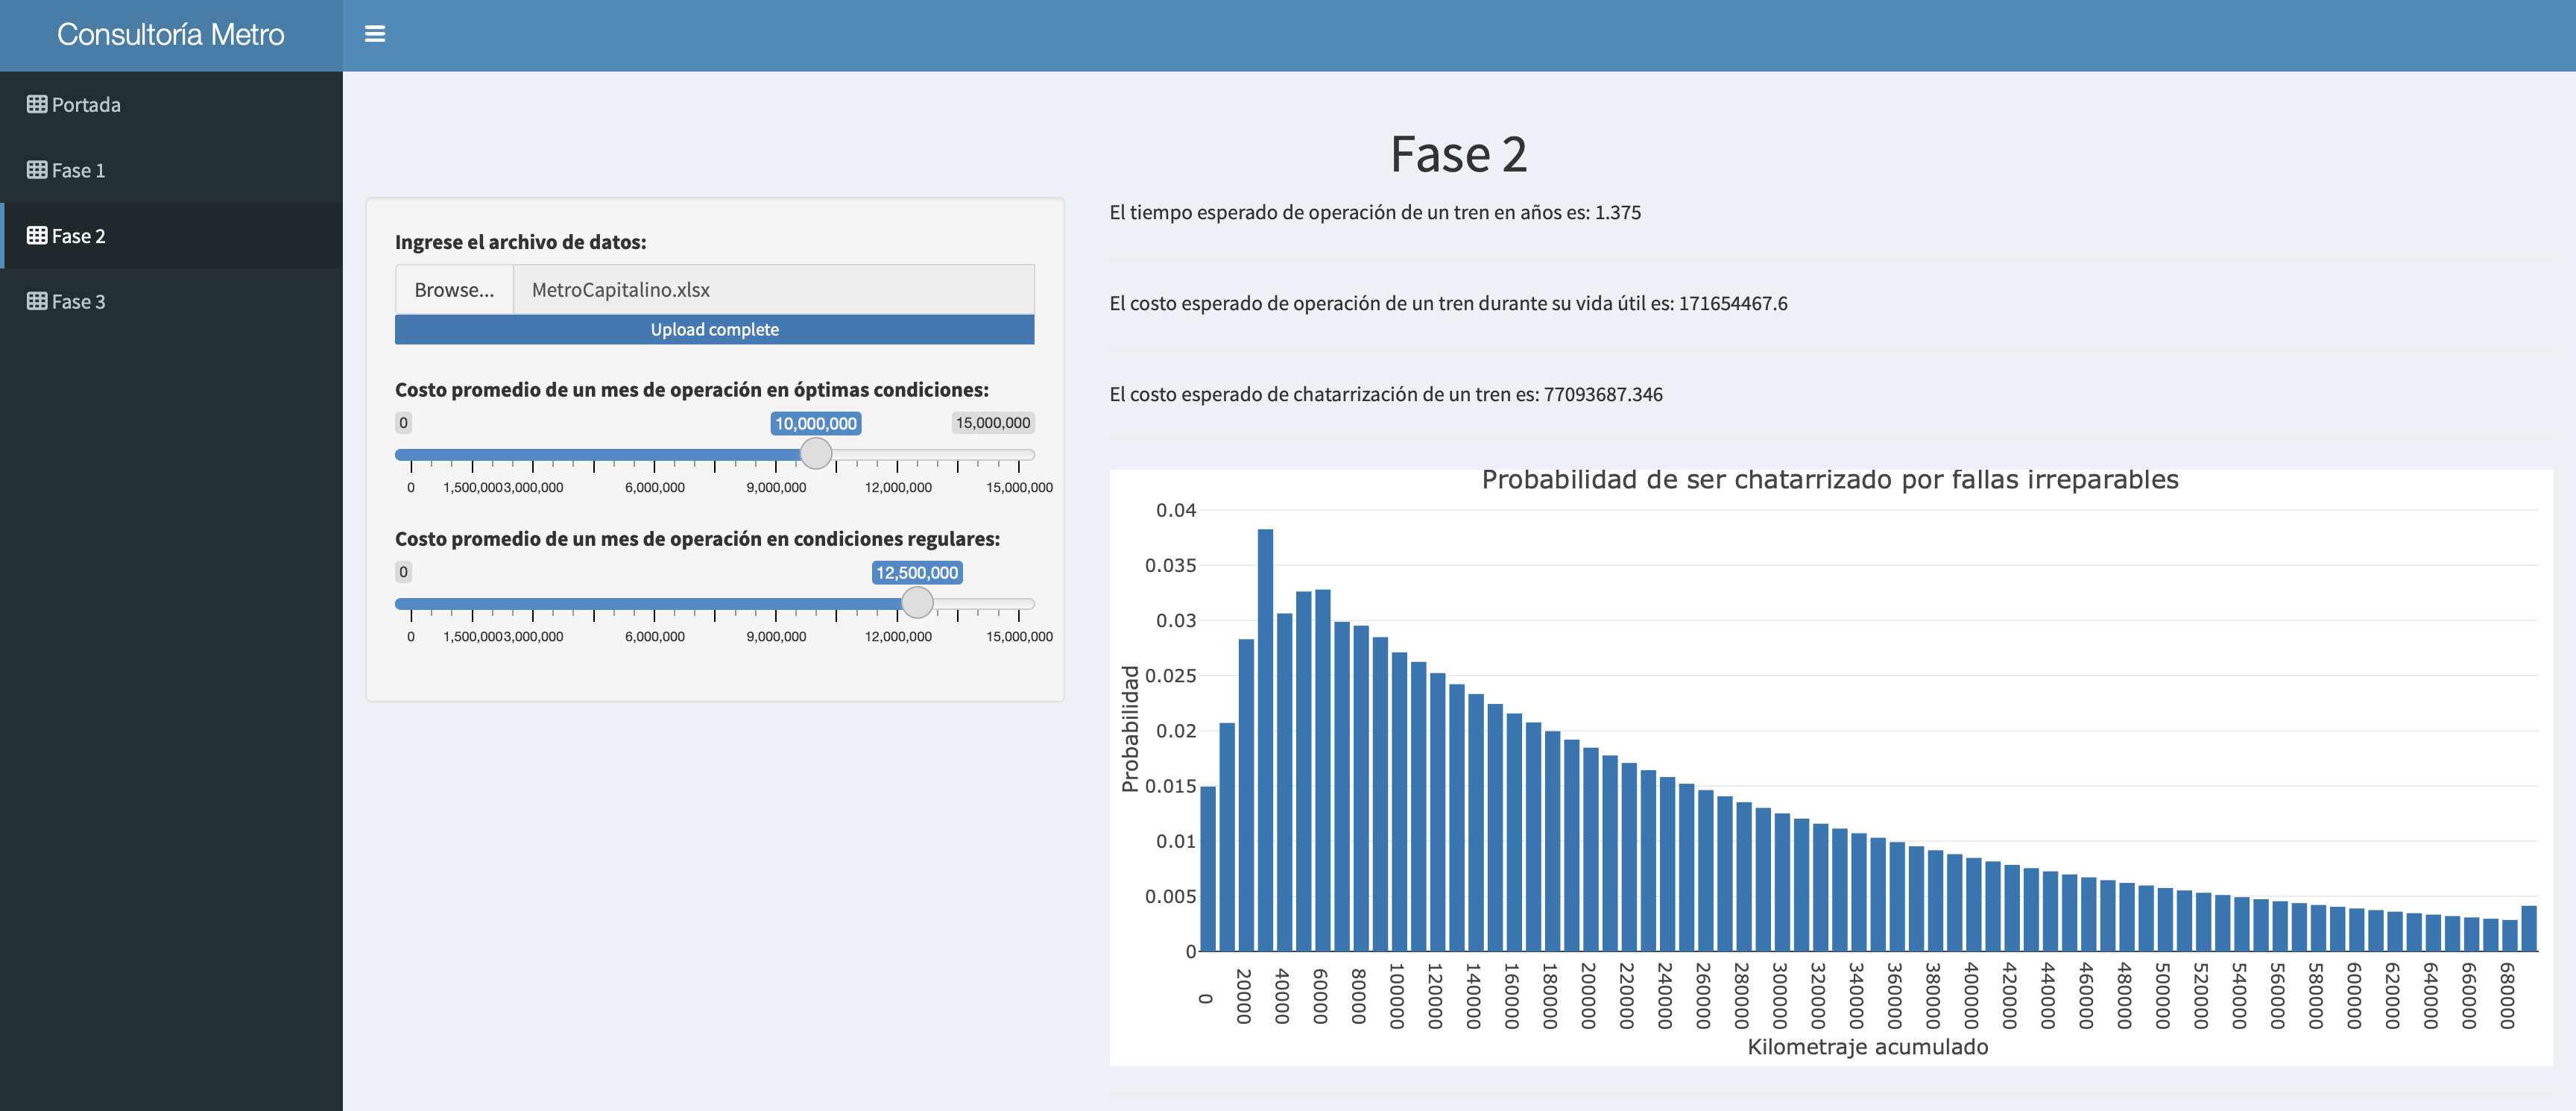
Model results and metrics
Tech stack
R
Shiny
shinydashboard
plotly
markovchain
readxl
Docker
Getting started
Docker
docker build -t metro-r-image .
docker run --rm -p 3838:3838 metro-r-image
Local R execution
cd src
R -f app.R
Project structure
src/
  app.R
  Fase_1.R
  Fase_2.R
  Fase_3.R
  www/image.jpeg
assets/
  MetroCapitalino.xlsx
Dockerfile
LICENSE
License
MIT License.